
Multiple Locations on a Single Graph
Last modified:
Trending Multiple Locations on a Single Graph
In Report Center, you are now able to create a single graph with sensors from multiple
Zedi Access locations. Previously, the user was only able to graph one location at a time. Please follow the steps below:
1. In Zedi Access, select multiple locations.
2. Open Report Center found under Reports at the top of your Zedi Access screen.
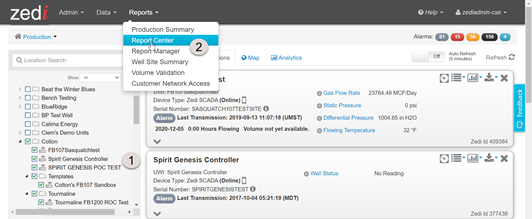
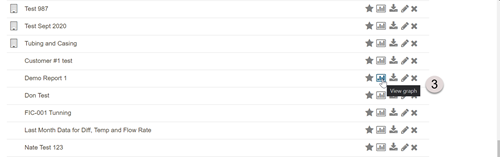
3. Select the report needed and view graph button.
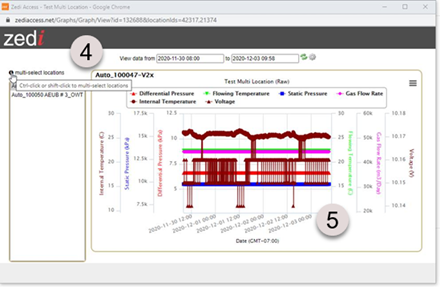
4. Select the multi-select locations above list of locations on the left side. Ctrl-enter or shift-enter to select multiple location in the list.
5. Enlarge the graph by dragging the window edge. In the legend, color and symbol are assigned for the sensors.
6. Please note that sensors from the same location will have the same color and the same sensor types will have the same data point symbol on the graph.
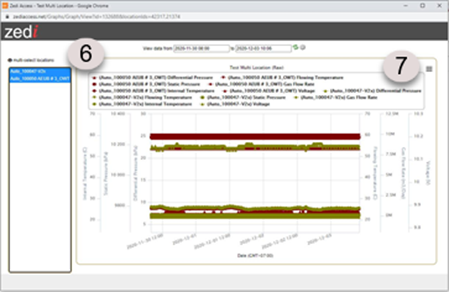
It is recommended to use the same type of devices which have the same sensor types for multiple location graph to maximize this new tool.