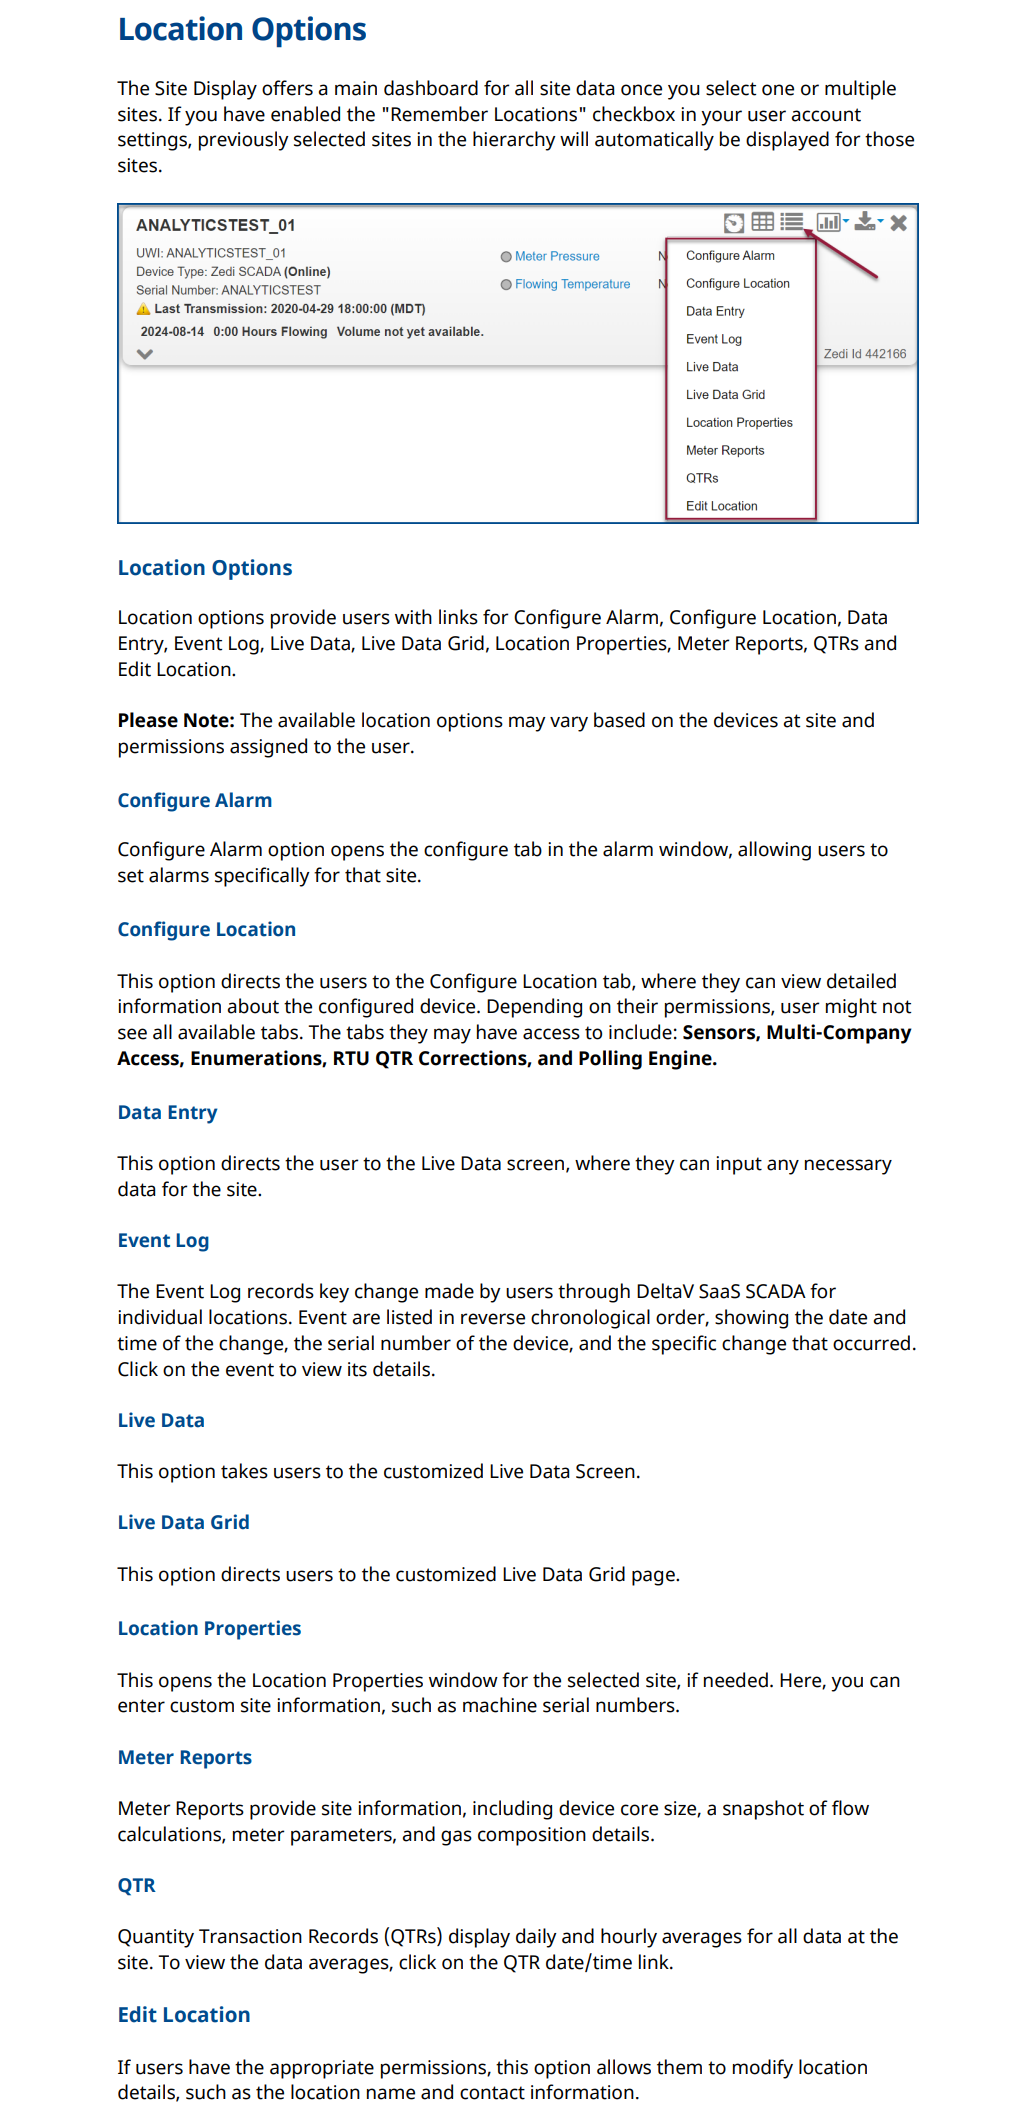
Location Options

The Well Site Display provides a main dashboard for all well site data once a well, or multiple wells, have been selected. If the "Remember Locations" checkbox has been enabled within your user account set-up, and you have previously selected wells in the Well Tree to work with those wells will automatically be displayed.

Image 222

Location Option dropdown list provides you the links for Alarm Manager, Configure Location, Event Log, Flow Parameters, Instrument Log, Location Properties, Meter Reports, and QTRs
Please Note: The location option dropdown list will vary depending on the device at site.
Configure Alarm
Opens the Alarm Manager window, showing the current alarm status for the selected well. Alarm Manager is used to set up alarm parameters for data measurements.
Configure Location
There are tabs across the top of the window which contain separate groups of settings you can change. You may not see all of the tabs shown because of your configuration or account security permissions.
  1. In the Sensors Tab, select the sensors to display in the Wellsite Information Area of the Well Site Data Display window.
  2. In the MCAF Tab,you can view the multiple companies who have access to this location and what their permissions are.
  3. In the Enumerations Tab, map the Sensor being displayed with the appropriate RTU Tag and Data Type.
  4. In the RTU Meter Reports Tab,(if applicable), select the sensors that map to the appropriate fields for the report.
  5. The RTU QTR Corrections Tab is used to view/create QTR timing corrections applied to processing a yesterday value for Zedi SCADA sites.
  6. In the Pollsets Tab, combine different sensors (RTU register values) into groups called Pollsets, which can be triggered by a single command. Each Pollset requires unique sensors (RTU register values). Place basic sensors and yesterday value sensors in separate poll sets.
  7. In the Data Interval Tab, set the time interval, in minutes, that information is to be sent to Zedi Access. This feature is used for Well Testing, when fine resolution time data is required. The lowest interval you can set is one minute.
Event Log
The Event Log records key change made by users through Zedi Access with respect to individual locations. Event changes will be listed in reverse chronological order. Each Event shows the date/time of the change, the serial number of the field instrument on the changed site, and which of the two event changes occurred. Click an event to view.

Flow Parameters
The Flow Parameters window is where the gas composition and flow parameter configuration for Smart-Alek are set, in order to perform the AGA 8 Volume calculation correctly. The user is responsible for updating these values. There are always defaults in place until the initial values to go in, but for correct gas flow data it is important that the User enters the correct values as soon as possible.
Instrument Log
The Instrument Log records Events generated by the field instrument, such as calibration dates.
Location Properties
Opens the Location Properties window for the selected well. Here you can enter custom wellsite information, such as machine serial numbers or location cost centers.

Meter Reports
Meter Reports show the site information such as device core size, provides a snap shot of the flow calculation, meter parameters, and gas composition information.

QTR
Quantity Transaction Record. QTRs show the daily and hourly averages for all the data on the wellsite. The QTR readings are defaulted to Hourly and can be switched to Daily by clicking Daily QTRs at the top of the screen. You can view the data averages by clicking the QTR date/time link.
Live Data
The Live Data option is available for Zedi SCADA, Zedi Connect, MTRAC, SilverJack, and third-party configurations.

TrueChart
Access scanned chart images and monthly Gas Volume Statements.

Edit Location
If you have the appropriate Permissions, this allows you to change location name, contact information etc.

Is this article helpful for you?