Well Site Display
The Well Site Display provides a main dashboard for all well site data once a well, or multiple wells, have been selected. If the "Remember Locations" checkbox has been enabled within your user account set-up, and you have previously selected wells in the Well Tree to work with those wells will automatically be displayed.
To select a well or field of wells, click the checkbox next to the well or field in the Well Tree. Once selected the Well Site Displays appear on the right side of the home page. Each well is displayed separately, scroll down the page in your web browser to view more wells.
![]()
If you'd like your wells displayed in a particular order, you must select them in the well tree in that order (i.e., select the well you want displayed at the top of the Well Site Data Display first, then select the next well you'd like displayed, etc).
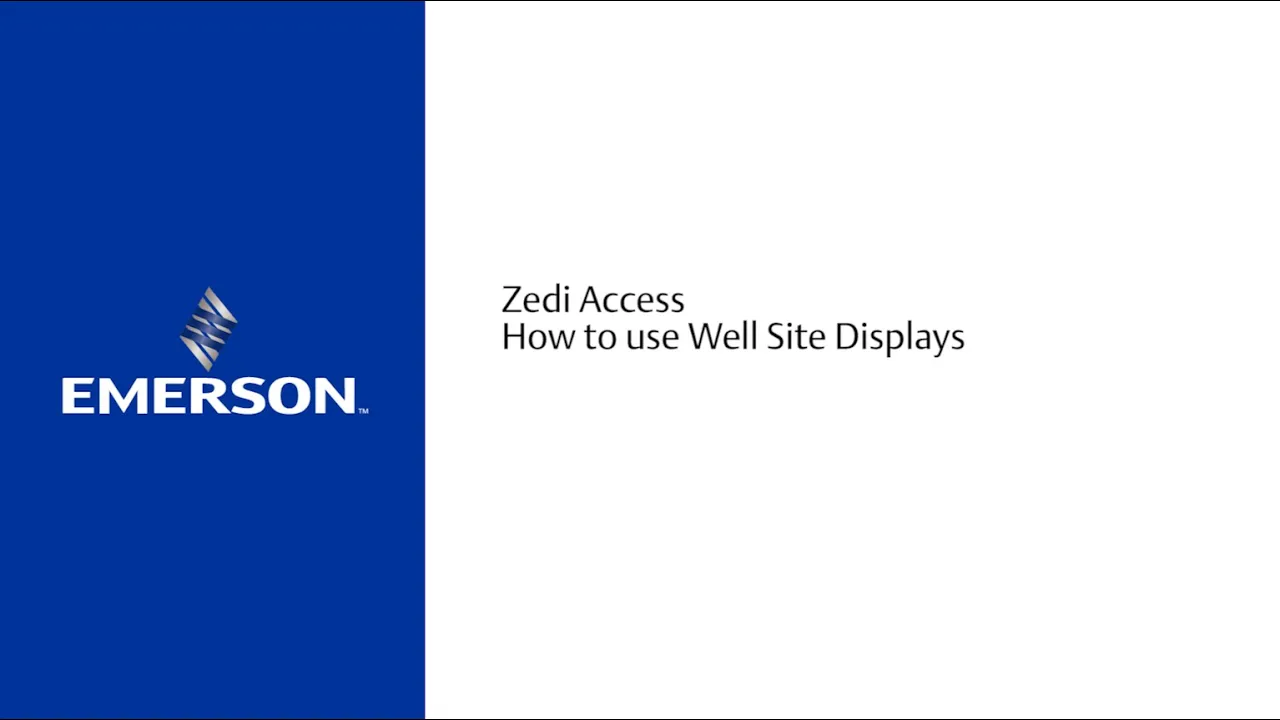
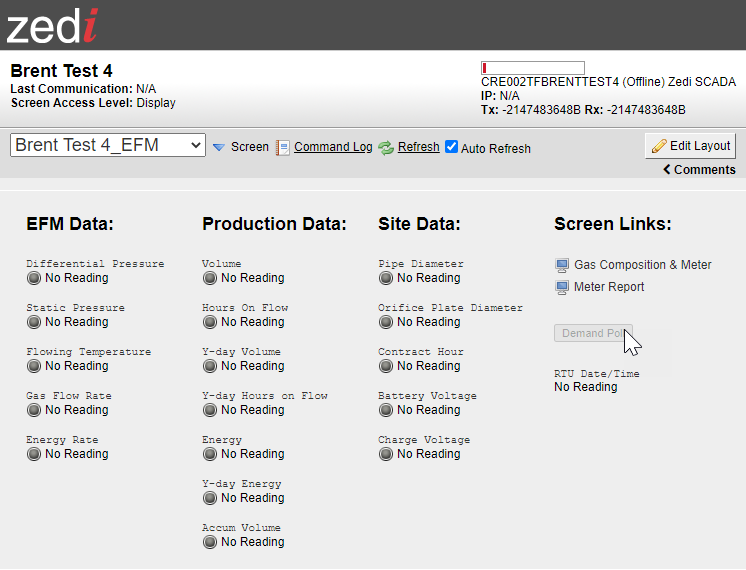
Well Site Displays provides a main dashboard for all well site data once a well, or multiple wells, have been selected. The letters in this graphic correspond to the following sections:
a. Main Display - shows device type on site, last transmission time, Today's Hours on Flow and current Volume for the day, as well as the last day of data for Hours on Flow and Volume.
b. Primary Sensors - shows the primary sensors for the device type of the well.
c. Sensor drop-down list - shows all other sensors associated to that location. It will pop down automatically if a sensor is alarming.
d. Icons on the top right of the display, to access location-specific functions:
![]()
Site Options is a drop-down list for links to Alarms, Configure Location, QTRs, Well Test Satellite, Location Properties, etc.
![]()
Favorite Reports for one-click access to view-only reports for the selected well sites. To create your own private reports or create company-wide reports, use Report Center.

TrueChart icons for one-click access to scanned chart images and monthly Gas Volume Statements.
![]()
Live Data for one-click access to your Live Data screen, only on SCADA-enabled locations.
![]()
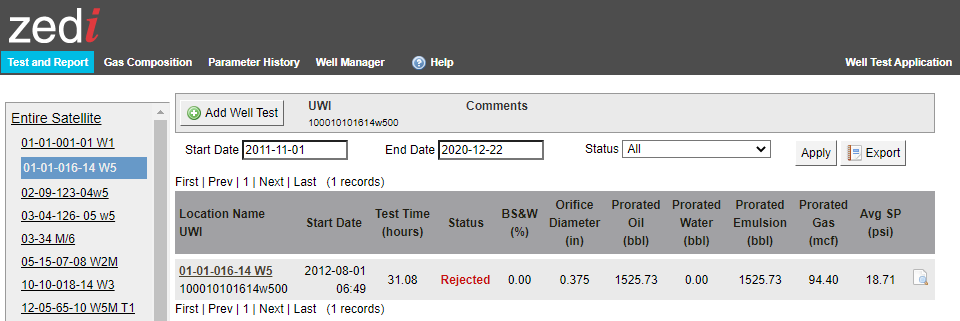
Well Test Satellite for locations that have the well test satellite feature enabled.
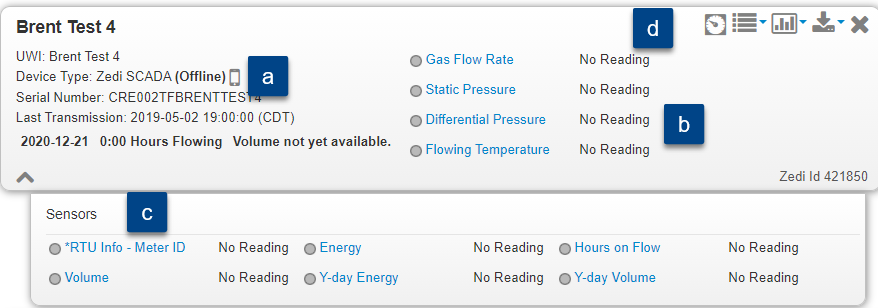
Sensor Drop-Down List
View the sensors configured for a well site by simply clicking on the down arrow in the lower left of the well site display.
![]()
The sensor drop-down list will automatically open if a sensor or sensors are in alarm state for that well site.
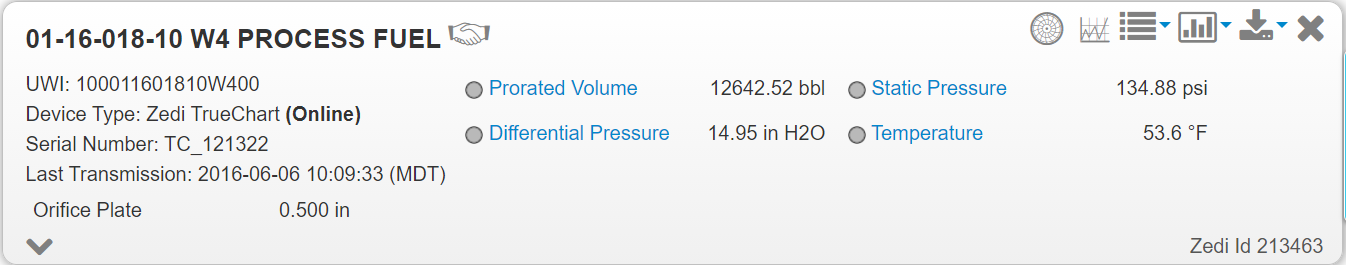
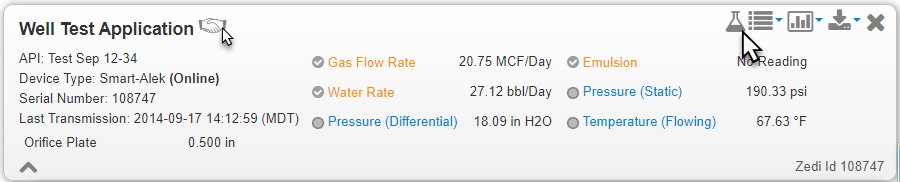
Sensor Panel
This area displays instantaneous sensor data.
![]()
A green indicator to the left of the sensor name means the parameter is within operating limits.
![]()
A orange (high/low alarm) indicator means that the parameter is outside the server alarm limits.
![]()
A red indicator (high high/low low alarms) means that the parameter is outside the Field Instrument Cryout Alarm limits.
![]()
A grey indicator means that the sensor is late in reporting data or is not configured to report data. Sensors that fail to report for their scheduled reporting period.
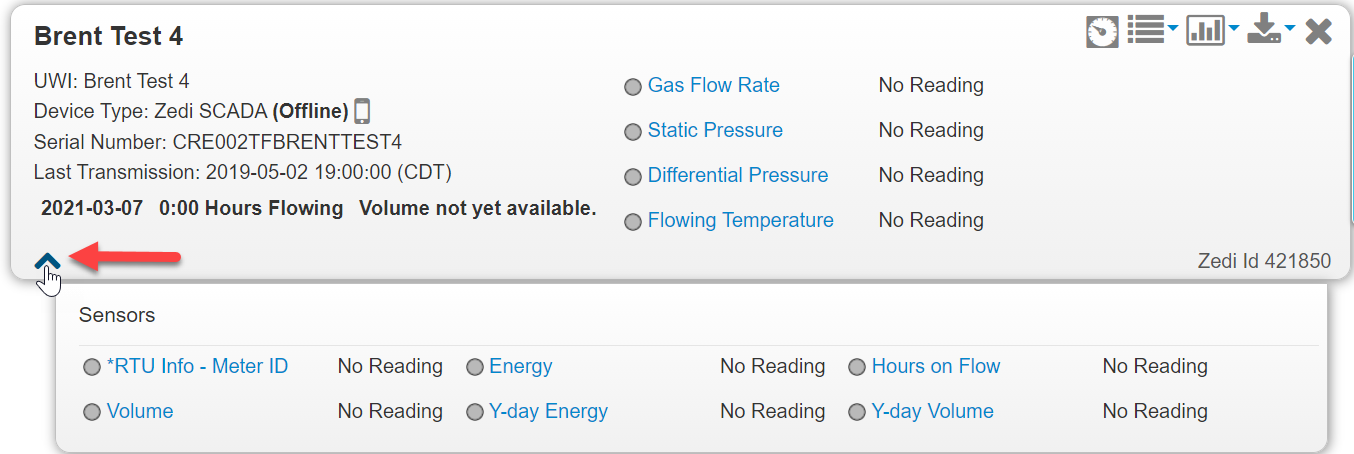
One-Click Sensor Reporting
Simply click on the name of a sensor within the sensor panel to produce a dynamics trend graph of the last 7-days of data.
To expand the date range of this report, select your desired start and end date from the date selector at the top of the graph and choose refresh.
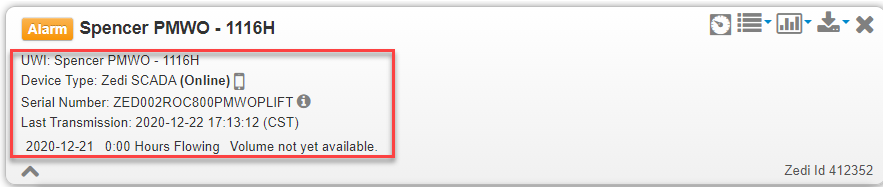
Main Display
View the device type on site, last transmission time, Today's Hours on Flow and current Volume for the day, as well as the last day of data for Hours on Flow and Volume.
![]()
A caution sign will appear next to Last Transmission if the device on site has not communicated for over 48 consecutive hours.
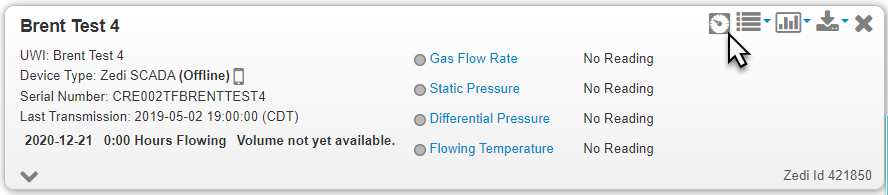
Well Site Display Icons
![]()
Site Options is a drop-down list for links to Alarm Manager, Configure Location, Event Log, Flow Parameters, Instrument Log, Location Properties, Meter Reports, and QTRs.
![]()
The site option list will vary depending on the device at site.
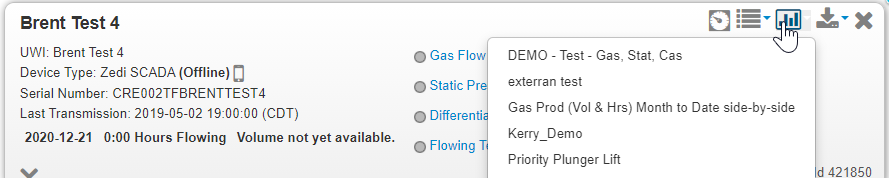
![]()
Favorite Reports for one-click access to view favorite reports for the selected well site. From the dropdown menu choose the report for which you want to view a graph, you will get a graph using data from the selected location. To create your own private reports or create company-wide reports, use Report Center.
This dropdown will only produce graphs for the selected location. To apply a graph to all locations currently open in the Well Site Data Display, use Report Center.

TrueChart icons for one-click access to scanned chart images and monthly Gas Volume Statements.
![]()
Live Data one-click access to your Live Data screen for control, only available on Zedi SCADA locations
![]()
Well Test Satellite for locations that have the well test satellite feature enabled.
![]()
Contact Zedi Customer Care to enable well test satellite on a location
Customer support service by UserEcho
