New Updates on Zedi Access – February 22nd, 2024
Last modified:
This promotion included the following updates.
- New Report Center Options– Zedi Access users now have more options available when creating reports and graph.
- New Graph Option in Live Data Screen – Zedi Access users can now see multiple locations within one Live Data screen.
- Online Device Status – Users can now see total number of devices, in the alarms panel.
New Report Center Options
Users now have more options available when creating reports and graphs.
1. In Report Center, under Data Options. Select the sensors for graphs and reporting.
a. Sensor name can be modified to trend name, by selecting trend name. This will now show on the graph and the report export as the trend name.
b. Data resolution can be adjusted for each sensor: Raw, Hourly QTR, and QTR for a single graph or report. This gives the user the ability to mix and match data resolution for each sensor.
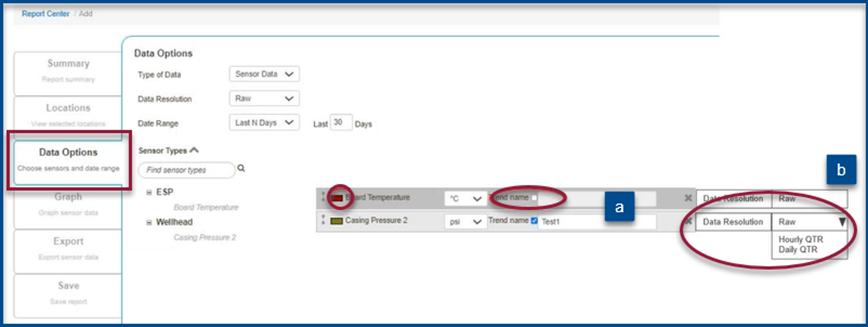
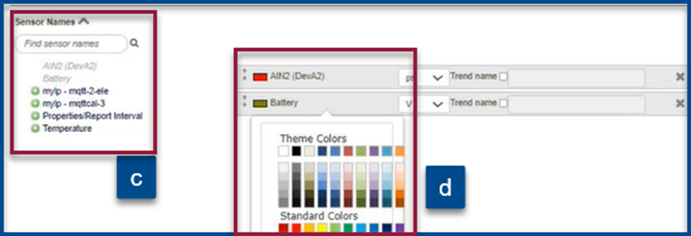
c. Sensors can be selected by name, even if it doesn’t have Sensor Type assigned.
d. Sensor Colors for graphing can now be modified by selecting the desired color.
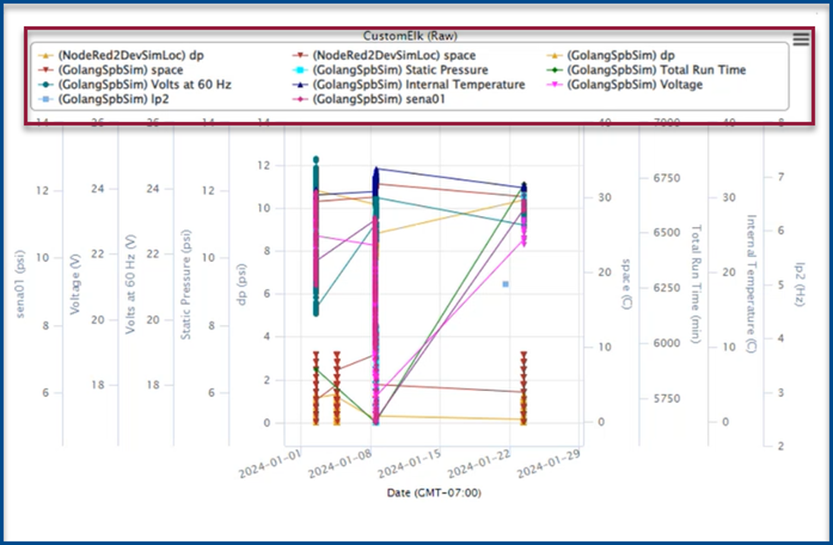
2. Users can now select as many sensors as they would like on one graph or report, they are no longer limited to 6 sensors.
New Graph Option in Live Data Screen
Zedi Access users can now see multiple locations within on one graph in Live Data screen for all related locations.
Please note: This needs to be set up by the Zedi Access team to create locations that are related to one another.
- Users can see all the locations by default or use Ctrl or Shift button to select/deselect any combinations of locations that they would like to view.
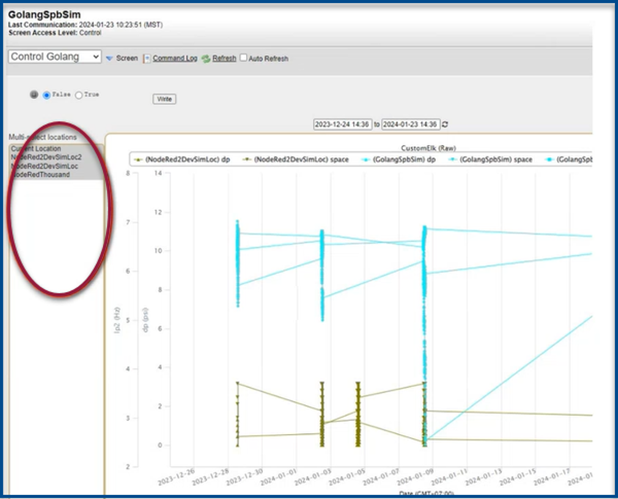
Sensors can be selected on the graph to remove and view.
Please note: Y-Axis grouping will be the same Unit of Measure to prevent axis clutter as well as dimmable trend lines.
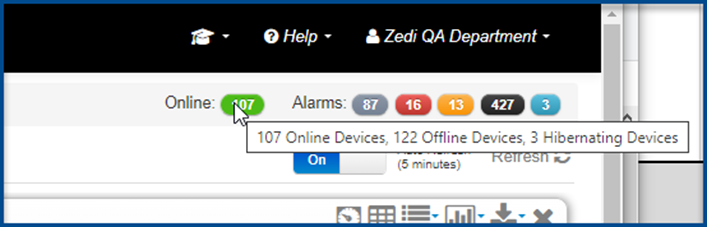
Online Device Status
The total number of devices online will now be displayed in the alarms panel.
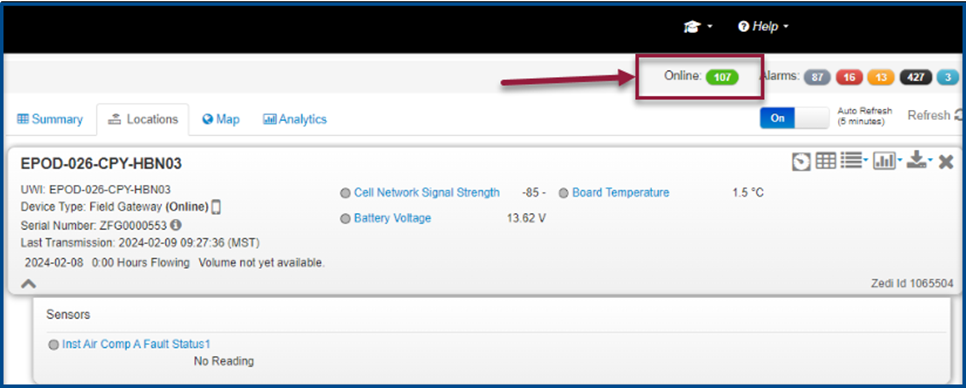
Hover over the icon to see the total number of devices: Online, Offline and Hibernating.