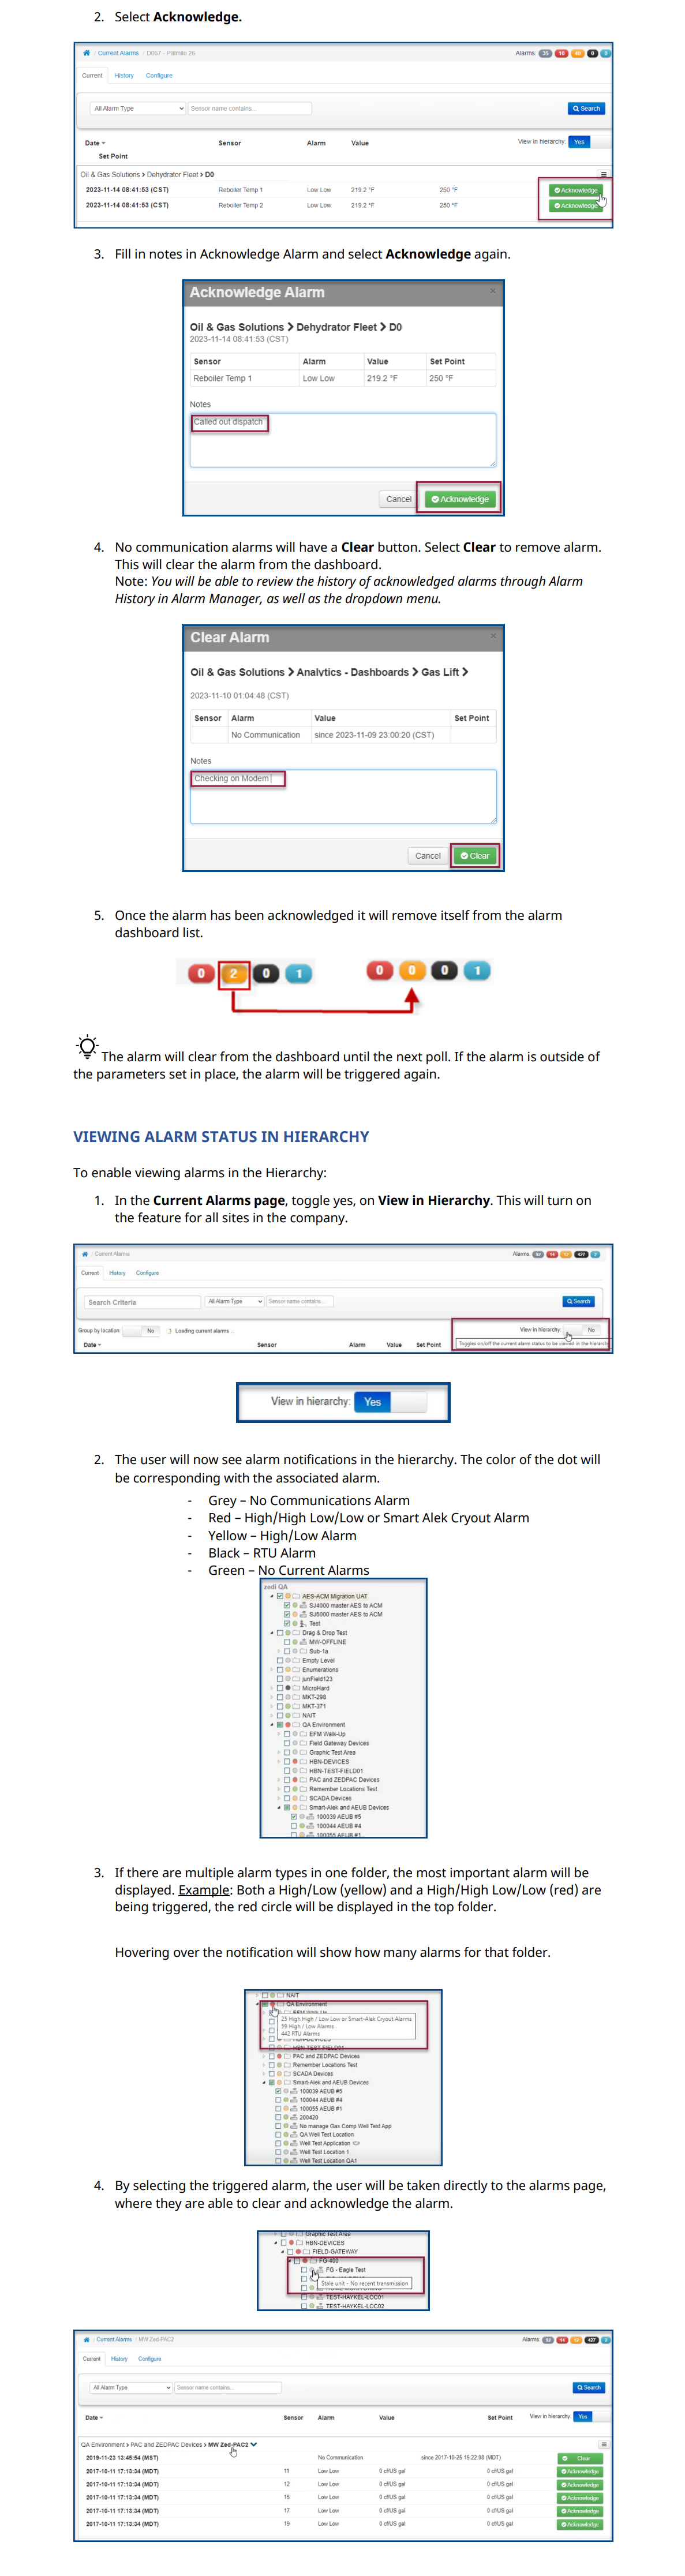
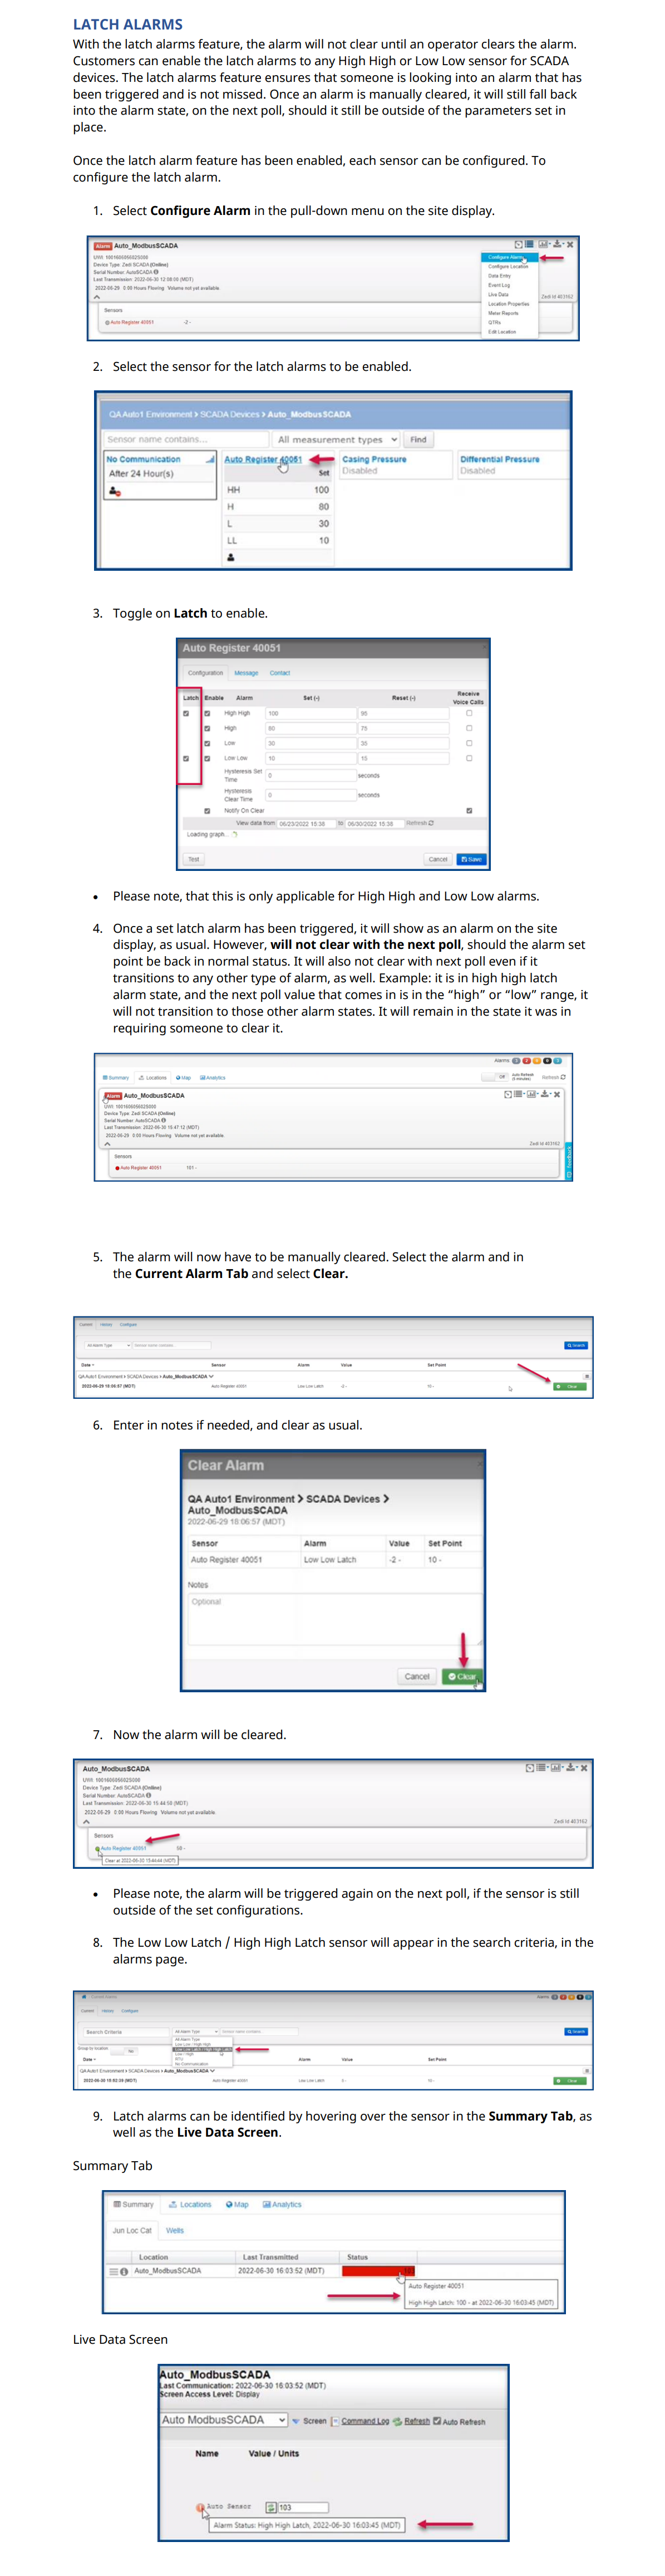
Overview Alarms

In Zedi Access you will have the ability to set server-based alarms for any sensor on any EFM device. Server based alarms are triggered by Zedi Access and are based off the last reading taken by the device in the field. The alarms may automatically be cleared when the sensor transmits within the normal operating range. Once alarming, Zedi Access can send either a text message, email, or both to the end user to notify them.

ALARM TYPES

Image 1508

  1. Grey – No Communication Alarms, this site does not have any communication.
  2. Red – High High / Low Low or Smart-Alek Cryout Alarms, this site is very outside of the parameters put in place.
  3. Orange/Yellow – High / Low Alarms, this site is slightly out of the parameters put in place.
  4. Black – RTU Alarms.
  5. Blue – Location Missing Flow Parameters Configurations, indicates which sites flow parameters need to be updated.

ENABLE ALARMS

A sensor must be enabled for alarms to be configured. To enable server alarms:


1. In the site display, select the pull-down menu and select Configure Location.


Image 1509


2. Find the sensor that to enable and select Edit.


Image 1510

3. Select Enable Server Alarms.

4. Save.


Image 1511

5. The sensor will now show in the Configure Tab in alarms and can be set.


Image 1512


    SETTING ALARMS

    1. There are a few ways in which you can access the configure alarm screen to begin configuring them:

      a. The first option is to click the Options dropdown menu and select Configure Alarm. This will take you directly to the configure alarm screen for the site selected.

      Image 1513

      b. The second option is to select from the colored Alarm icons on the top right of the screen. This will take you to the configure alarms screen where you will select Configure and select the Location.

      Image 1514

      Image 1515


      c. Finally, you can select Alarms in the Admin pull down menu in the top left of the home page. This will take you to the configure alarms screen where you will select Configure and select the Location.


      Image 1516

      Image 1517


      2. Once you are in the configure screen, choose the sensor you would like to set the alarm for by selecting the name in blue. (ie. Gas Flow Rate)

      Image 1519


      At a quick glance you are able to see what the, UOM is, and what the High High and Low Low is set at.

      The person icon indicates if there is a contact should the alarm be triggered. (Red indicates no contact has been set up)

      Image 1520

      3. Enter the value you would like the alarm to be tripped or set at for High High/Low Low and High/Low under the Set Level field. Enter your normal or reset value for each trip point.

      Image 1521

        Alarm Configuration settings available for a server alarm are:

        a. High High Set Level the level at which the high high alarm event triggers.

        b. High High Reset Level the level at which the high high alarm event is cleared. High High Reset Level Value = Set Level Value – Hysteresis

        c. High Set Level the level at which the high alarm event triggers.

        d. High Level Reset the level at which the high alarm event clears. High Reset Level Value = Set Level Value – Hysteresis

        e. Low Set Level the level at which the low alarm event triggers.

        f. Low Reset Level the level at which the low alarm event clears. Low Reset Level Value = Set Level Value + Hysteresis

        g. Low Low Set Level the level at which the low low alarm event triggers.

        h. Low Low Reset Level the level at which the low low alarm event is cleared. Low Low Reset Level Value = Set Level Value + Hysteresis

        i. Hysteresis Set Time- After the ‘x’ seconds, the RTU will demand poll and confirm whether that sensor is still in alarm state or if the alarm can be cleared. It will ultimately check the alarm status twice to confirm whether an alarm should be initiated or cleared

        4. You can change the dates to View Data from a specific range. 

        5. You can hover over the graph to see the exact time, date, and gas flow rate. 

        6. Select Test to ensure the parameters are enabled. 

        7. Click Save.

          View data graphs the dates selected for a quick view of alarms on this site.


          MESSAGE

          Messages can be customized to suit the device, person, or message center receiving the email or text message. The site location, the device Instrument ID, sensor type, alarm value, and the date and time of the alarm event as registered by the server can be sent in a text message. A very simple message can be used to convey only the relevant data. A short message like the example below may be used when the device has limited message length capability, or when the recipient is familiar with the alarms that have been set up.

          Example:
          An alarm event occurred at #TIM on the PAC, PAC2, or PAC4 #SDS, located at Battery #LOC in Field #FLD for XYZ Exploration Ltd. The sensor measuring #SEN with a value of #AMT is outside the range set at #MIN - #MAX. Please call John Smith at 780-555-5555.


          Message formats are:

          #FLD-Field Name
          #MAX-Alarm Maximum
          #AMT-Reading Amount
          #VALUE [equivalent to #AMT]
          #SEN-Sensor Name
          #TIM-Time and Date
          #MIN-Alarm Minimum
          #ERR-High or Low
          #LOC- Location
          #WELL-equivalent to #LOC
          #HIERARCHY


          1. Select Message for this sensor only or Message for entire location.
          2. Select Test to see if the message is sent out to the user and in the format that is required by the end user.
          3. Select Save.

          Image 1522


          CONTACT

          If an alarm is triggered, the contacts that are set up will receive the message. The User/Group must have email/text set up in the user setting of Zedi Admin. Follow procedures in Creating a New User.

          1. Choose if you would like the alarm contact to be an individual User, Group, or No Contact. Once clicked, select the user or group from the pull-down menu.
          2. The Contact Schedule will allow a group or individuals in a group to receive alarms on certain days based on scheduling preferences. ***See next page for creating schedule. ***
          3. Select the Maximum Retry times, up to 5 retries.
          4. Select the Retry Interval, varies from 60 seconds to 1 day (24 hours)
          5. Select Test to ensure that this has been set up correctly.
          6. Select Save.

          Image 1523


          TO CREATE A CONTACT SCHEDULE

          1. Within the Contact Screen (See above) select Contact schedule.

          Image 1524


          2. Select Add to create a new schedule or Select to open an existing schedule.

          Image 1526


          3. Create a name for the Contact Schedule and click Ok. The Contact Schedule will not move to the next step if the name has already been created.


          Image 1527

          4. The screen shows a list of contacts you can Add in the Contact Group box. You can select Weekdays. Enable the boxes of the users you would like to be in the Contact Group.

          Image 1528


          5. The window will redraw to display the calendar that is attached to the schedule. If Weekdays-days are selected, the cursor will be red, and you can click on any 1-hr period in the calendar to change it to red. The color bar next to the groups indicates which color is associated with which group. If you choose Weekend-nights, the cursor will be green. Double-check the calendar by cycling through each group to see if the colored boxes are correct.

            (Note: Don't forget to save the calendar between color changes or the changes won't be saved as intended and this may be a source of error for the routed alarm notifications).

            Image 1529


            6. If you choose to select or edit groups that will be assigned to the scheduling group, you must choose a group like Wednesdays-days and select the Edit function inside the Contact Group box. The popup window will display a list of users and groups in the company.


            7. You can enter/edit the name of the Contact Group, and you can select the calendar display color for the Contact Group. Next to the list of users and groups, you can select which user and group will be associated with the Escalation level. To make it easier you can simplify this by choosing only one level to use (Level 1). Try with Level 1 for now to ensure the feature is working properly.


            8. Click OK at the bottom of the window to save the changes.


            9. Continue with the rest of the groups that will take part in the schedule. Recommended Setup of User Groups for Contact Schedules Since the contact schedules allow for contact groups to be assigned, the groups used in the schedule should follow the shift schedules. So, as demonstrated above, the groups can be identified by the shift days and shift hours.

              Note: The schedule calendar repeats every week, so if you have a two-week rotation of personnel covering each shift, this won't work without making changes on a regular basis.


              Image 1530


              You will want to avoid changing the Contact Group in the calendar or for each alarm sensor. This defines a role-based system. It is recommended keeping the alarm contact schedule and calendar fixed and change the users in the groups according to their work rotation.


              ACKNOWLEDGING ALARMS

              There are 2 ways to acknowledge alarms, in the Site Display and in the Alarms Dashboard. The Site Display will show one location at a time, while the Alarms Dashboard will show all the alarms that have been triggered in that category. 


              1. To Acknowledge:   


              a. Site Display:


              Click on

              Image 1531

              the indicator. The Sensor panel will automatically expand when an alarm is activated. The alarm color will indicate the type of alarm that has been triggered. This will only show the location selected.

              Image 1532


              b. Alarm Dashboard:

              Image 1533

              Select the type of alarm that you would like to see. All the of the locations with alarms that have been triggered will show.


              2. Select Acknowledge.


              Image 1534


              3. Fill in notes in Acknowledge Alarm and select Acknowledge again.

              Image 1535


              4. No communication alarms will have a Clear button. Select Clear to remove alarm. This will clear the alarm from the dashboard.

              Image 1536

                Note: You will be able to review the history of acknowledged alarms through Alarm History in Alarm Manager, as well as the dropdown menu.


                5. Once the alarm has been acknowledged it will remove itself from the alarm dashboard list.

                Image 1537

                  The alarm will clear from the dashboard until the next poll. If the alarm is outside of the parameters set in place, the alarm will be triggered again.

                  VIEWING ALARM STATUS IN HIERARCHY

                  To enable viewing alarms in the Hierarchy:


                  1. In the Current Alarms page, toggle yes, on View in Hierarchy. This will turn on the feature for all sites in the company.


                  Image 1538

                  Image 1539

                  2. The user will now see alarm notifications in the hierarchy. The color of the dot will be corresponding with the associated alarm.

                    • Grey – No Communications Alarm
                    • Red – High/High Low/Low or Smart Alek Cryout Alarm
                    • Yellow – High/Low Alarm
                    • Black – RTU Alarm
                    • Green – No Current Alarms

                    Image 1540


                    3. If there are multiple alarm types in one folder, the most important alarm will be displayed. Example: Both a High/Low (yellow) and a High/High Low/Low (red) are being triggered, the red circle will be displayed in the top folder.

                      Hovering over the notification will show how many alarms for that folder.


                      Image 1541


                      4. By selecting the triggered alarm, the user will be taken directly to the alarms page, where they are able to clear and acknowledge the alarm.

                      Image 1542

                        Image 1544

                        LATCH ALARMS

                        With the latch alarms feature, the alarm will not clear until an operator clears the alarm. Customers can enable the latch alarms to any High High or Low Low sensor for SCADA devices. The latch alarms feature ensures that someone is looking into an alarm that has been triggered and is not missed. Once an alarm is manually cleared, it will still fall back into the alarm state, on the next poll, should it still be outside of the parameters set in place.

                        Once the latch alarm feature has been enabled, each sensor can be configured. To configure the latch alarm.


                        1. Select Configure Alarm in the pull-down menu on the site display.


                        Image 1545

                        2. Select the sensor for the latch alarms to be enabled.


                        Image 1546

                        3. Toggle on Latch to enable.

                        Image 1547

                          • Please note, that this is only applicable for High High and Low Low alarms.


                          4. Once a set latch alarm has been triggered, it will show as an alarm on the site display, as usual. However, will not clear with the next poll, should the alarm set point be back in normal status. It will also not clear with next poll even if it transitions to any other type of alarm, as well. Example: it is in high high latch alarm state, and the next poll value that comes in is in the “high” or “low” range, it will not transition to those other alarm states. It will remain in the state it was in requiring someone to clear it.

                          Image 1548


                          5. The alarm will now have to be manually cleared. Select the alarm and in the Current Alarm Tab and select Clear.

                          Image 1549


                          6. Enter in notes if needed, and clear as usual.


                          Image 1550

                          7. Now the alarm will be cleared.

                          Image 1551

                            • Please note, the alarm will be triggered again on the next poll, if the sensor is still outside of the set configurations.

                            8. The Low Low Latch / High High Latch sensor will appear in the search criteria, in the alarms page.


                            Image 1552

                            9. Latch alarms can be identified by hovering over the sensor in the Summary Tab, as well as the Live Data Screen.

                              Summary Tab

                              Image 1553

                              Live Data Screen

                              Image 1554

                              Is this article helpful for you?