Graph Control
Now you can see your sensors and graphs when
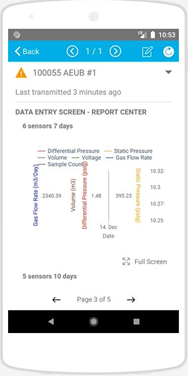
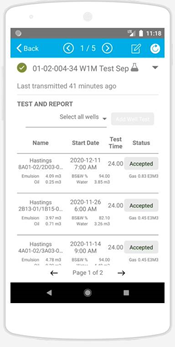
1. Live Data Screen that has source coming from report center
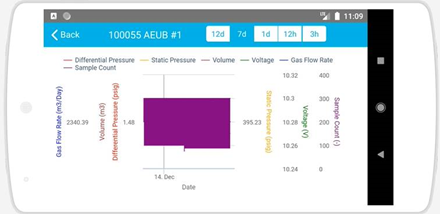
This is the “Full Screen” view.
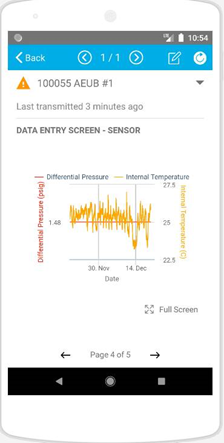
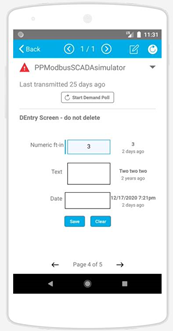
Live Data Screen coming from sensors
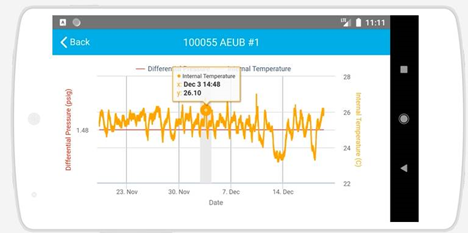
This is the full screen view with a tooltip.
2. This shows you a new line “Oil” and “Water” for 2-phase tests, a breakdown of “Emulsion”.
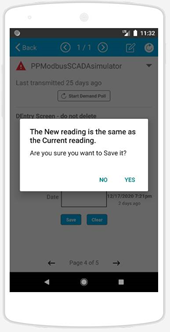
3. When you enter the same reading as the current value, you will get a warning message. You will have the option of saving it or not.
Customer support service by UserEcho
