Report Center
REPORT CENTER
Custom Reporting can be built and utilized within Zedi Access under Reports- Report Center. These report templates can be used for multiple locations and are customizable for graphing and spreadsheets. Multiple sensors (Up to 6) can be graphed or reported in one spreadsheet. You can save these reports as favorites to access them through the well site display or you can run them as a slideshow presentation. Reports can be made private or shared with an entire company.
Pre-built Reports that are strictly data and cannot be customized can be found under Data, Data Exports.
CREATING A NEW REPORT
1. Select a location that has the sensor types you would like to include in your report.
2. Click on the Reports dropdown menu
3. Select Report Center.
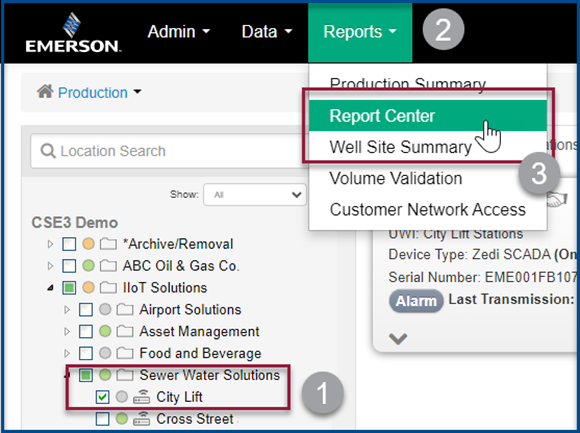
Please Note: All locations found within any Report within Report Center, are the locations you currently have selected and opened within the Hierarchy.
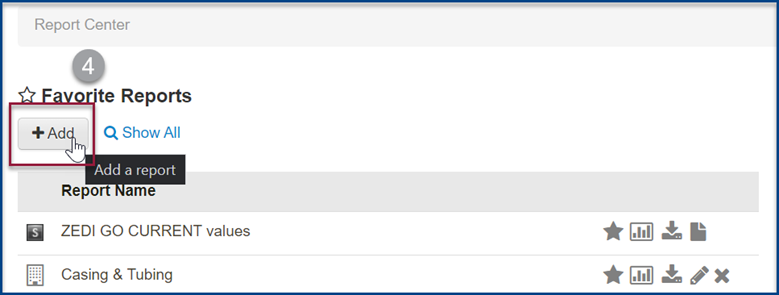
4. Select Add.
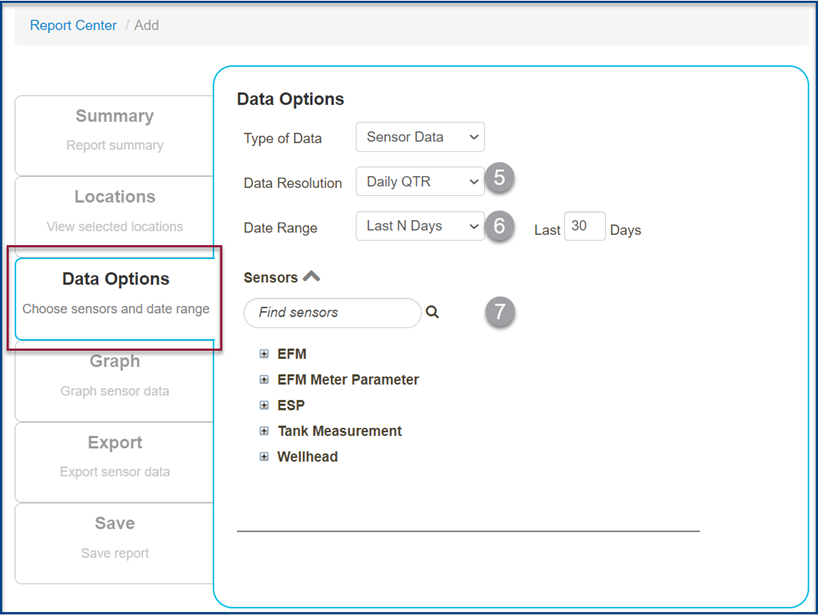
Data Options Tab
5. This screen is only for the location that you have open. In Data Options select your Data Resolution; Daily QTR, Hourly QTR, or Raw.
6. Select your Date Range; Custom, Last N Days (select the number of days that you are requiring), Month-to-Date, Last Month.
7. Select the Sensors you would to report on from the list on the left. This is based on what sensors are set up for this location. Graphical reports can only display six sensors at a time.
If you are unable to see the sensors you are looking for may be because:
- The locations open do not contain the type of sensor you are wishing to build the report for.
- The location sensor names may be named differently from the sensor types. To find sensor type used per sensor please see below.
a. In the Site display, select the options pull down menu and Configure Location.
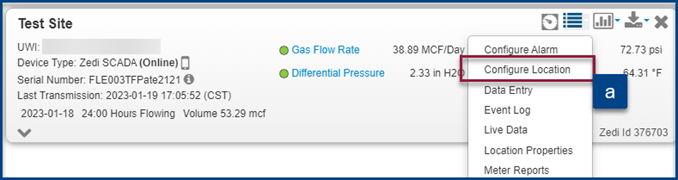
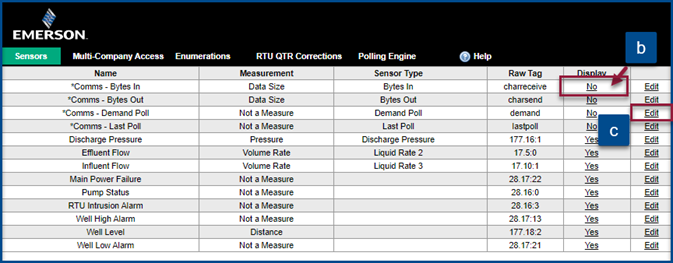
b. This screen will show all the sensors that are set up for this location. Yes or No in the Display indicates if this is active and displayed on the Well Site Display.
c. Select Edit to change the display status.
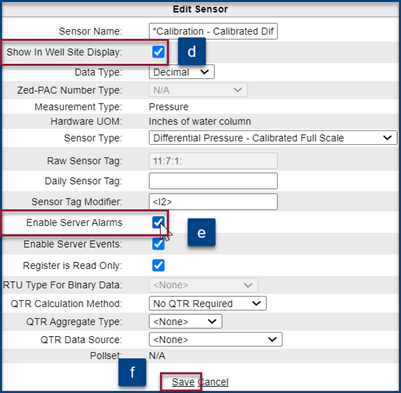
d. In the Edit Sensor screen, select Show in Site Display.
e. Select Enable Server Alarms.
f. Select Save to complete. This sensor will now be on the Well Site display as well as in reporting.
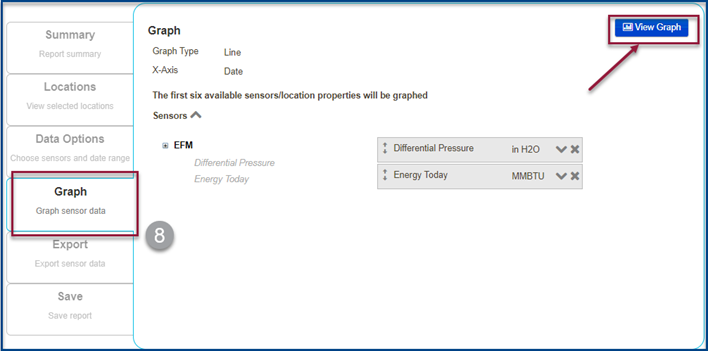
Graph Tab
This tab will show the sensors selected.
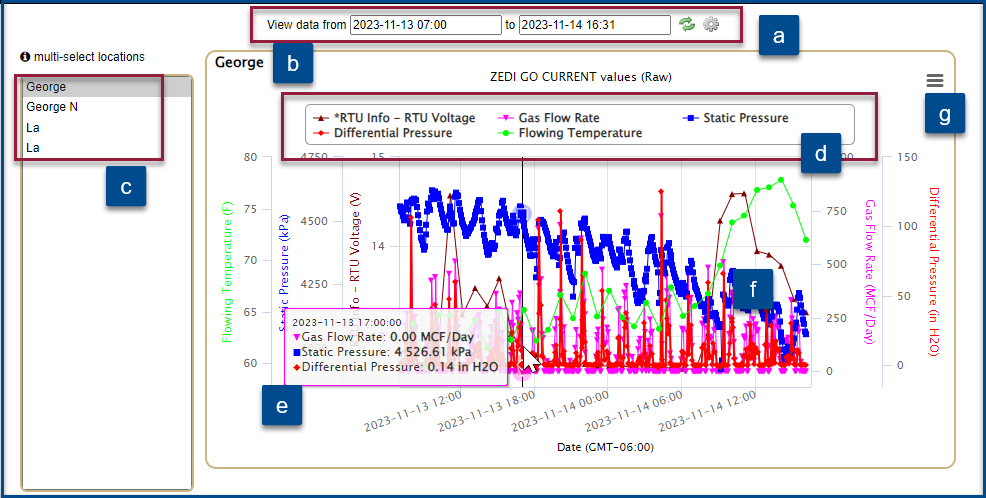
8. Select View Graph to preview your parameters.
a. View data from are the dates your report is reporting for. You can choose a different date by clicking on the date and selecting it from the calendar and selecting refresh.
b. This is the location you are currently viewing.
c. This is the list of locations you have selected and can view in the report. You can highlight all locations to graph multiple locations.
d. These are the sensors that this location is reporting. You can remove them temporarily from the graph by clicking on the name of the sensor.
e. Hover over each data point to see the values, date, and time.
f. Right click and drag with your mouse to zoom in on an area of the graph. To zoom out click the refresh button up at the top of the screen.
g. Pull down menu to print the graph and download in a PDF, JPEG, PNG or SVG.
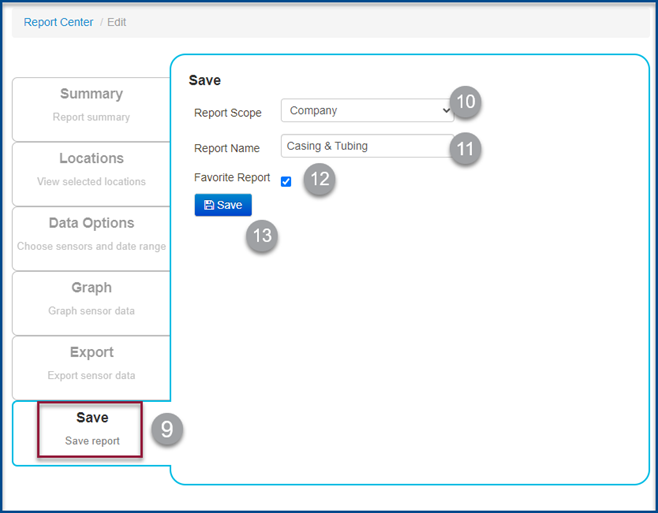
9. Select the Save Tab.
10. Report Scope allows you to select if you would like the report to be shared with the company or a report only accessible to your Zedi Access login.
11. Name the report.
12. Select Favorite Report if you would like the report available when you first open Report Center or on the Well Site Display.
13. Select Save to complete.
14. To report on multiple locations for the same report go to the Report Center drop down.
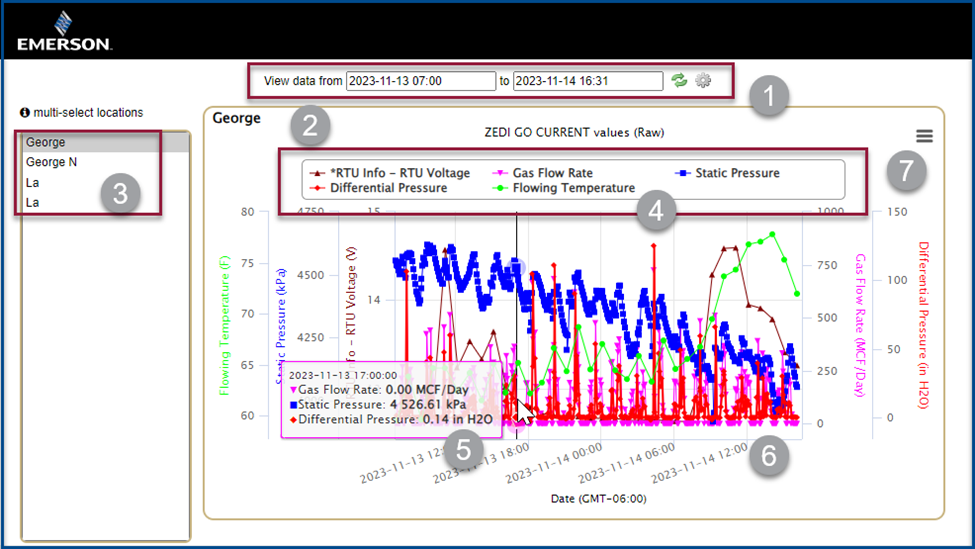
When you select graph the below screen will appear. You can modify the date range.
When hovering over the graph, the date, time, sensor type and readings will appear.
View Graph
- View data from are the dates your report is reporting for. You can choose a different date by clicking on the date and selecting it from the calendar and selecting refresh.
- This is the location you are currently viewing.
- This is the list of locations you have selected and can view in the report, highlight these to graph all at the same time.
- These are the sensors that this location is reporting. You can remove them temporarily from the graph by clicking on the name of the sensor.
- Hover over each data point to see the values, date and time.
- Right click and drag with your mouse to zoom in on an area of the graph. To zoom out click the refresh button up at the top of the screen.
- Pull down menu to print the graph and download in a PDF, JPEG, PNG or SVG.
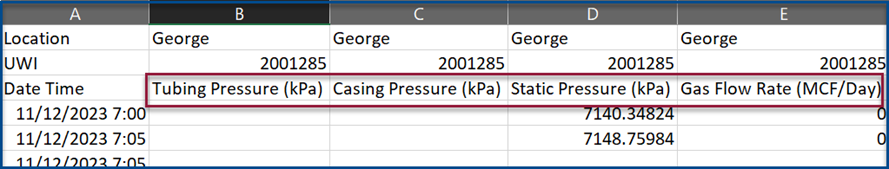
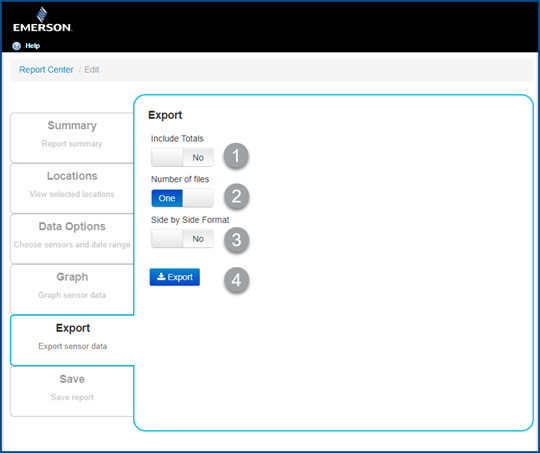
Export to Excel
In the Report Center Add Screen, you can select export, for the location(s) selected.
1. Select Yes/No if you would like to Include Totals for the export.
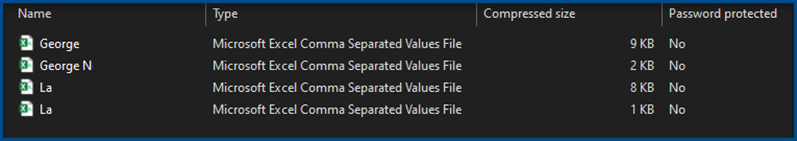
2. Select the Number of Files that you would like to export. When selecting Many, the site that are selected will be all exported in individual Excel sheets. When selecting One, only the first one will be exported to an Excel sheet.
3. Side by Side Format will show the sensors side by side in the Excel sheet.
4. Select Export to obtain the report. This will export in an Excel format.
a. You can also select favorited reports, available on the Well Site Display under the Graph or Export button.
Running Data Exports
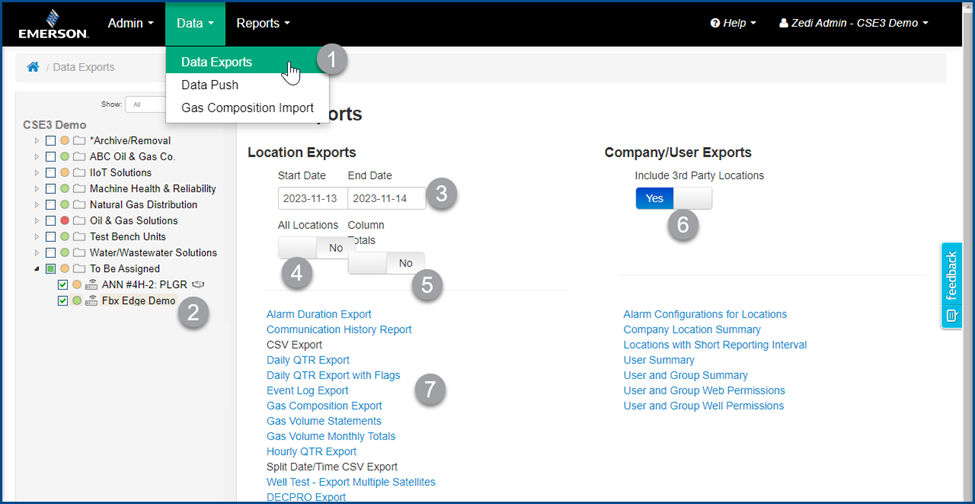
1. Click on the Data dropdown menu and select Data Exports.
2. Select your location(s) from the Well Tree you would like to export. The data will be presented in an Excel file format and all the information is prebuilt. The report cannot be generated without selecting at least one location.
- Some reports only work when selecting one location at a time, the reports in black are not available when selecting multiple locations
3. Select the Start and End date for your report.
4. Select All Locations (Yes/No) this will show all locations the user has access to.
5. Select Column Totals (Yes/No) this will total columns in the report.
6. Select Include 3rd Party Locations (Yes/No) this will include all 3rd party locations in the report.
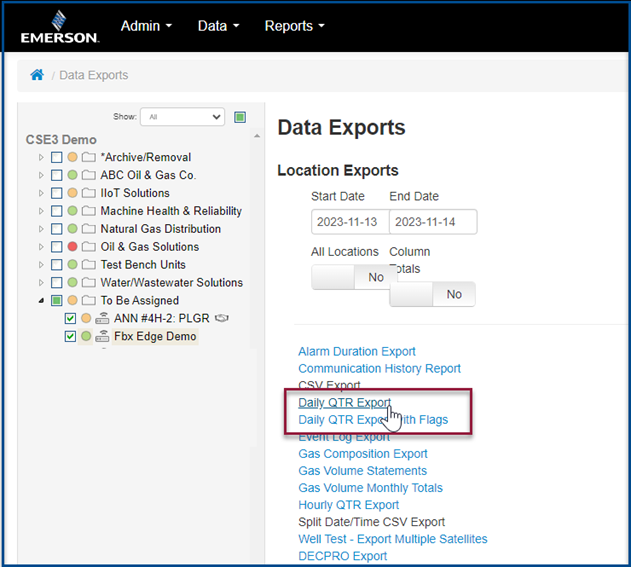
7. Select the Export Format you would like the data formatted for and the file will open.
- Daily QTR Export (works for multiple location selection) is all your QTR sensors in a 24-hour average
- CSV Export (works for only a single location selection) is the raw data your device is transmitting (for Smart-Alek it is 5 min averages and SCADA it can be 3 min all the way to hourly)
QTR’s
QTR’s are sent out daily to selected users at the company, via email or text. This report gives the daily average of the sensors that have been connected. You may receive a call, regarding the QTR report not being transmitted or that certain sensors are not in the QTR.
1. If the customer is looking to have their QTR report resent out, in the Data Exports screen, you can select daily QTR export. This will only be for the sites that have been selected.
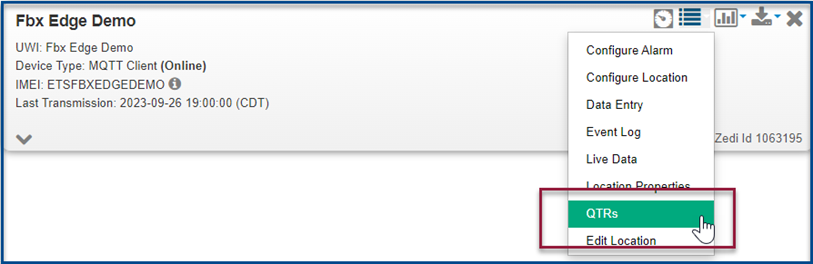
2. Search for QTR’s by selecting the pull-down menu on the well site display and select QTR’s.
Customer support service by UserEcho
