Basic Navigation

ZEDI ACCESS MAIN SCREEN
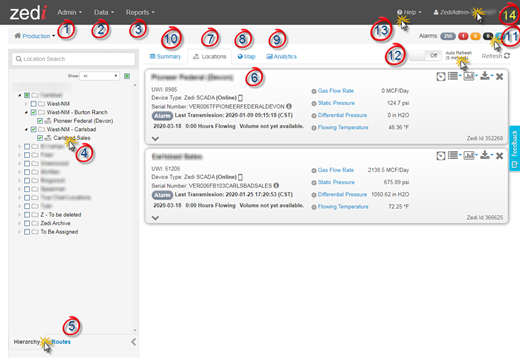
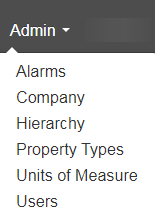
1. Admin pull down Menu
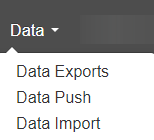
2. Data pull down menu
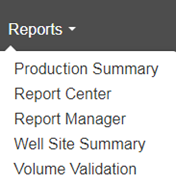
3. Reports pull down menu
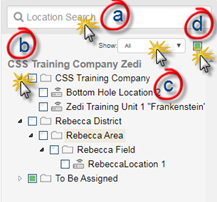
4. Well Tree Hierarchy
Location Search.
Select Location to expand and show details
Show (filter) locations
- All
- Online
- Offline
- Hibernating
Select/Deselect all locations
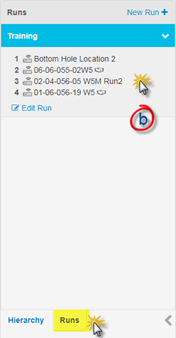
5. Hierarchy/Runs
Hierarchy will show all the locations in the order that was set by admin.
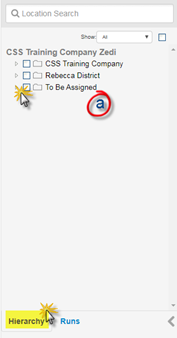
Runs are user specific and will show the locations in order the user has set up. Note: This will be called Routes for our American customers.
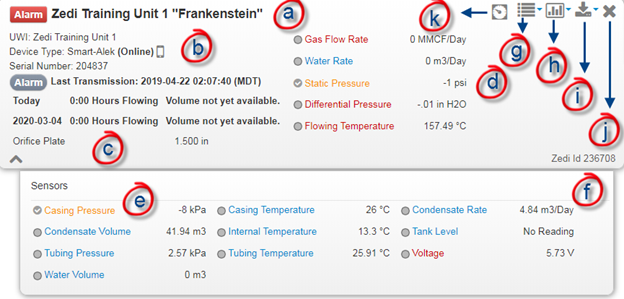
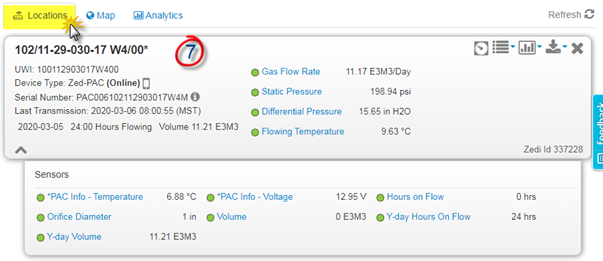
6. Well Site Display
A. Name of the location. Alarm notice will be to the left of the name if triggered.
B. Location Information
- UWI (Unique Well Identifier)
- Device Type (Online/Offline/Hibernating)
- Serial Number
C. Last Transmission, date and volume.
D. Sensors, colors relate to alarms.
E. Expand Senor Panel, more sensors on device.
F. Zedi Id
G. Pull down Menu
- Configure Alarm
- Configure location
- Data Entry
- Event Log
- Location Properties
- Meter Reports
- QTRs
-Edit Location
H. Graph Location using reports
I. Export Location using reports
J. Close location
K. Live Data Screen
7. Locations Tab
The Locations Tab will show the below screen when you have selected the site that you would like to see.
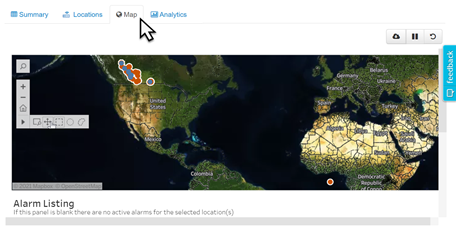
8. Map Tab
The Map tab will show where the site selected is located. You can select multiple sites and filter by:
Legend
![]()
Devices Online.
![]()
Devices Hibernating.
![]()
Search for the region/country/city you want to zoom into.
![]()
Select to zoom in or double click the screen.
![]()
Select to zoom out or shift + double click.
![]()
Select home to get go back to the original screen.
![]()
Select the right arrow for more menu items.
![]()
Select for magnifying glass icon to zoom.
![]()
Select to pan the map.

Select shape to highlight are.
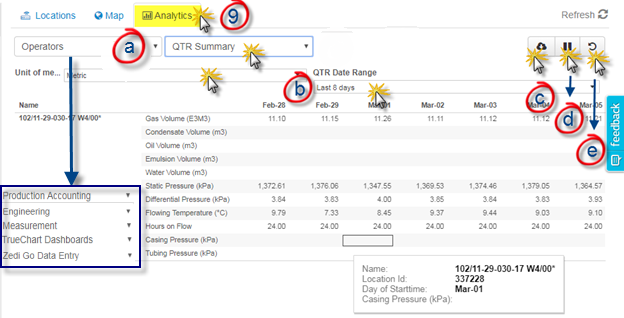
9. Analytics tab
a. Select the type of Analytics report in this pull-down menu. The menu to the right matches the selection.
Operators
- QTR Summary
- QTR Graph
- Alarms
Production Accounting
- Previous Month
- Production Summary
- Month to Date
- Production Breakdown
Engineering
- Volume Trend
- Cumulative Production
Measurement
- Intro
- Patm Out of Range
- Primary Element
- Base Temp and Pressure
- Line Size
- Default Density
TrueChart Dashboards
- Chart Coverage
Zedi Go Data Entry
- Gauge Report
B. Depending on the type of report you are inquiring about, you may have this pull-down menu for you may have several different pull-down menus. In the below example is the Units of Measurement and QTR Date Range.
C. To Export this screen to an excel file, select this icon.
D. To Pause/Resume automatic updates, select these icons.
E. To Revert Changes that you have made, select this icon.
10. Summary Tab
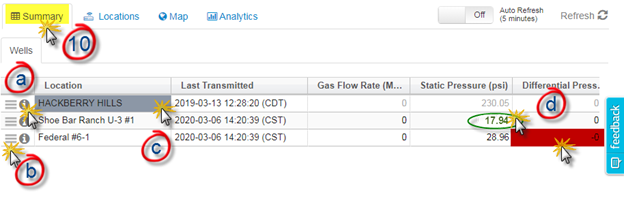
A. The icon is additional location details.
![]()
B. The icon is the same as the options menu on the Well Site Display (Locations tab). From this icon, you can access Live Data and see custom reports and graphs.
![]()
C. Color shaded cells represent Alarms
Grey background on location field —No Comms Alarm
Orange/Yellow cells —High/Low alarms
Red cells —High High and Low Low alarms, or Smart-Alek cry out alarms
D. Black Font: Live Data
Green Font: Alarm set points have been “enabled” for this sensor
Grey Font: Stale Data, has not transmitted in the last 24 hours
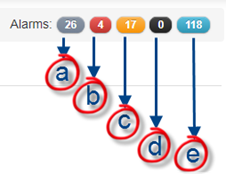
11. Alarms
A. Grey – No Communication Alarms, this site does not have any communication.
B. Red – High High / Low Low or Smart-Alek Cryout Alarms, this site is very outside of the parameters put in place.
C. Orange/Yellow – High / Low Alarms, this site is slightly out of the parameters put in place.
D. Black – RTU Alarms, not in use.
E. Blue – Location Missing Flow Parameters Configurations, indicates which sites flow parameters need to be updated. Most not in use.
12. Refresh Tab/Auto Refresh
When looking at the screen, it will not automatically refresh. Select the Refresh tab
to get the most up to date information. You can also select the Auto Refresh for an update every 5 minutes. NOTE: Not all customers will have this feature activated.

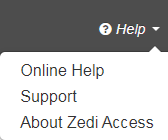
13. Help pull down menu
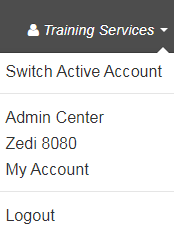
14. Company pull down menu
Customer support service by UserEcho
