Basic Trend Reporting
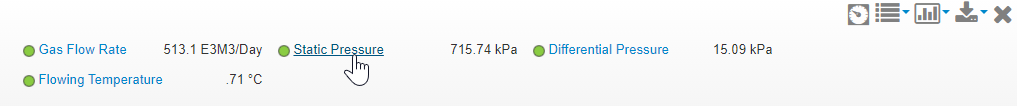
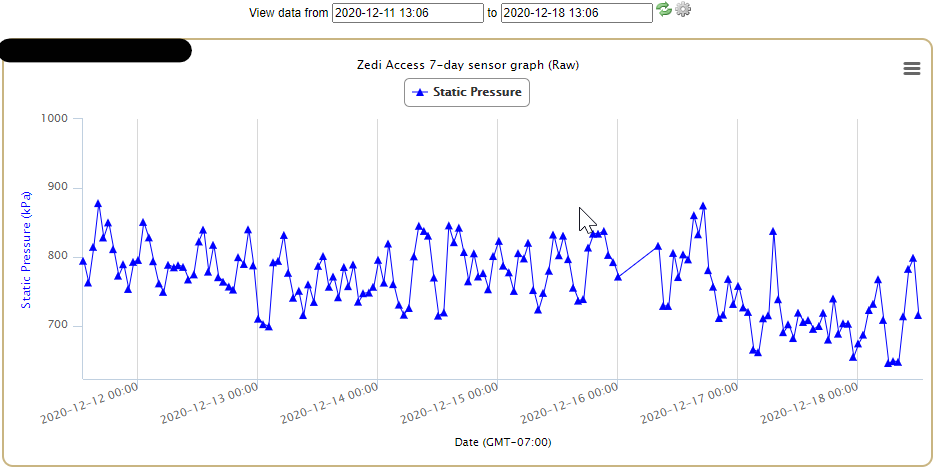
Click on the variable in the sensor dropdown list on the the Well Site Display. A simple graph will generate to show the last 7 days of data for any of the variables that are reporting information, which allows you to change the date range.
For example, an Operator simply clicks the Static Pressure sensor before traveling to a well site can help them make informed decisions about potential problems, even help he or she decide if it is even necessary to visit a well.
The first time you use this feature, you may be asked to accept the ChartFX plugin. Click Yes to enable graphic reporting. (You will only need to do this once per computer). If you are unable to load this plug-in, contact your internal IT support group for technical assistance.
Customer support service by UserEcho
