TrueChart Reports
This article details the two ways of accessing TrueChart Reports, or Gas Volume Statements (GVS), available on Zedi Access. either using the Well Site Display or the Chart Viewer Toolbar.
![]()
Gas Volume Statements are produced as .pdf files. To view them, software that is capable of opening a .pdf file (such as Adobe Acrobat Reader) is required.
Using the Well Site Display
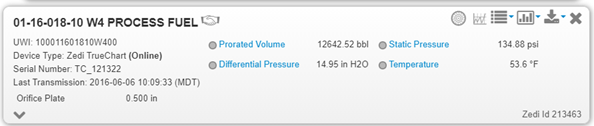
After you have found well you wish to view, there are two ways to access reports:
1. Select the report icon on the top right-hand corner, or;
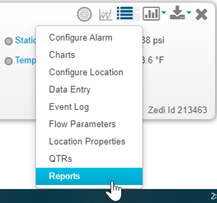
2. Select Reports in the drop-down menu on the top right.
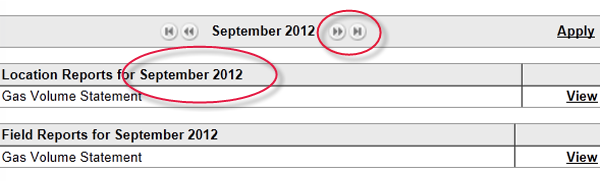
3. The Zedi TrueChart Reports window opens. Select the month you want to view chart reports for with the arrows on each side of the month currently displayed.
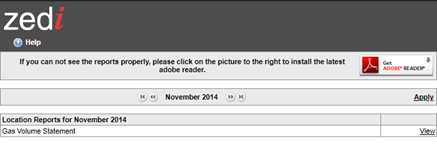
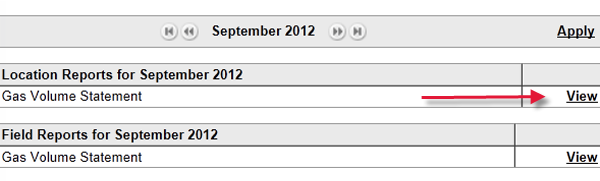
4. Click the View link to the right of the desired report. The Report will be downloaded and opened.
Both TrueChart icons are quick links to Charts and Reports.

Using the Chart Viewer Toolbar
1. Follow the procedures to view a chart as described in Viewing Zedi TrueChart Data.
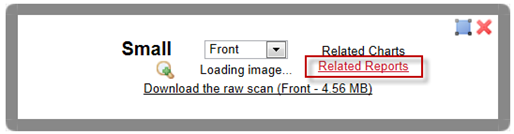
2. In the viewer toolbar, click the Related Reports link to view reports related to the chart you are currently viewing.
3. The Zedi TrueChart Reports window opens on the month of the selected chart. You can select other months with the arrows on each side of the month currently displayed.
Click the View
link to the right of the desired report.
The Report will be downloaded and opened.
Customer support service by UserEcho
