Well Tree Hierarchy
When you login to Zedi Access, the Well Tree appears on the left side of the window. If the "Remember Locations" checkbox has been enabled within your user account set-up, and you have previously selected wells in the Well Tree to work with those wells will automatically be displayed.
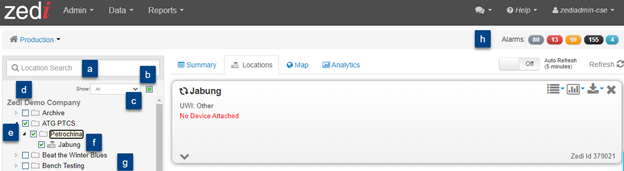
A. Search tab - To search for a specific location, enter part or all of the location name into the Search field, Zedi Access will active search for the location as soon as you start typing. Select the location from the dropdown list, and it will be chosen within the Well Tree.
B. Deselect All - Click on this box to deselect all selected wells on the well tree. Doing so will clear all well site displays within Zedi Access.
C. Hide - Click on this to hide the well tree. To re-display the Well Tree, click on the arrow pointing right next to the Home link.
D. Top Levels or Districts - The first level is the Top Level or District. To display the next level, click the district name or the arrow left of the district name.
E. Child Levels or Areas- All secondary levels of groupings viewed after clicking on the top level or district are referred to as Child Levels Areas.
![]()
Further levels can be set up to group fields under Districts and Areas.
F. Locations - To select individual locations, expand the field lists and check the box of the appropriate wells. Checking the box next to the well will bring up the Well Site Data Display box in the right side of the screen.
![]()
If you'd like your wells displayed in a particular order, you must select them in the well tree in that order (i.e., select the well you want displayed at the top of the Well Site Data Display first, then select the next well you'd like displayed, etc).
G. Icon -
![]()
indicates a joint venture; hover over the icon to see who owns the device at location.
H. Alarm Dashboard -on the home page will show you all locations in a current alarm state, you may notice well site displays open with alarm status displayed. The links in the Notification Bar are active, you can view the alarm details directly by clicking on the red or orange dots to view all locations with a cryout alarm or a server alarm, respectively. RTU no transmit alarms are indicated by the black dot, and locations that require flow parameter or gas composition information are identified with the blue dot.
Customer support service by UserEcho
