Viewing Zedi TrueChart Data and Gas Volume Statements
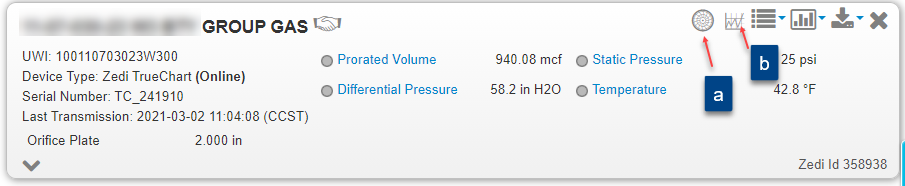
1. Click the chart icon within the well site display
a. View image of scanned charts
b. View monthly gas volume statement.

2. Select view image of scanned charts (a), TrueChart Readings window opens.
3. Select the Date Range you want to view charts for, by selecting the Start Date and End Date.
4. Click Apply.
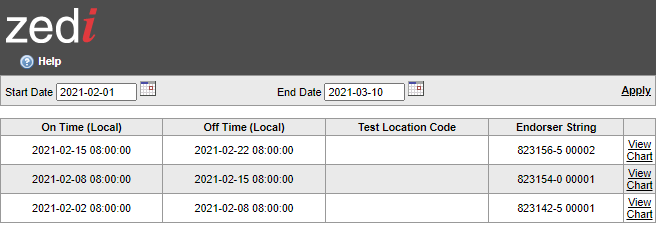
5. Click View Chart for the specific chart you want to view.
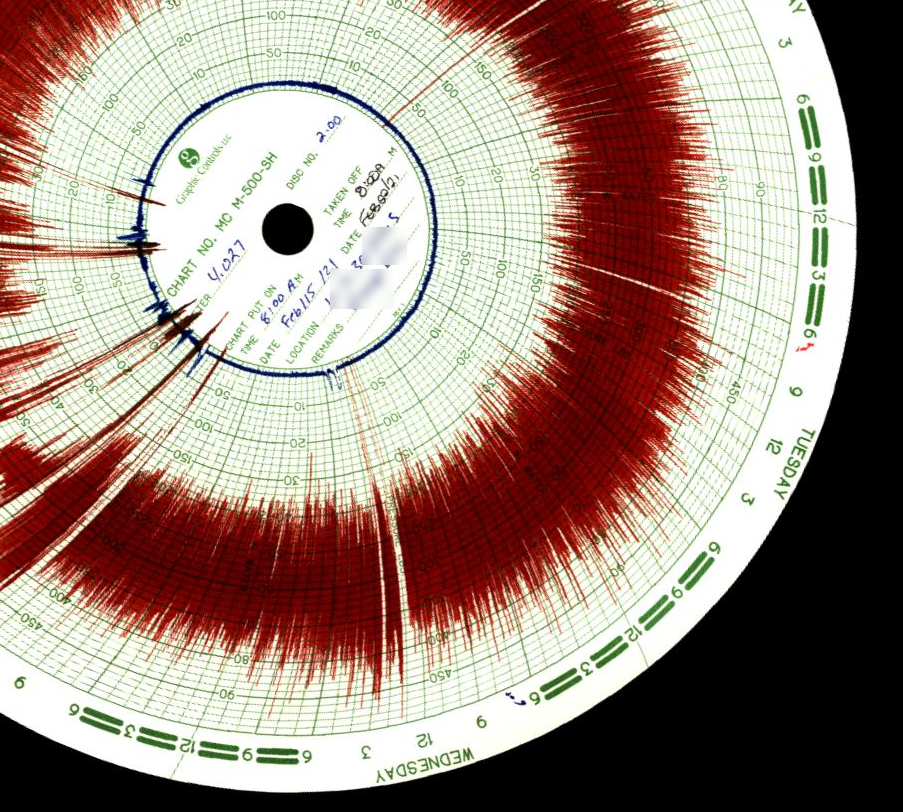
Chart Viewing Options
Once in the image viewer, you are given different chart viewing options. The default viewing option is the front view of the original scan. To see other views select the desired view from the dropdown menu:

- The Overlay is the digitized version of a chart that is used for performing the sensor averages and flow volume calculations.
- The Back is the scan of the back side of the chart, which sometimes features handwritten information from operators.
- The Cartesian takes the polar Overlay and plots it on a standard X/Y grid. This is often an easier way to view the data trend.
The selected viewing option is displayed once it is chosen through the dropdown menu.
Other Viewer Features
Other features of the image viewer on the toolbar are as follows:
- For a higher resolution larger view of the image, click the
 zoom icon. Click the
  zoom out icon to get a smaller image.
 - To download the original image at full resolution, click the Download raw scan link.
- The Related Charts link returns you to the Zedi TrueChart Readings screen, with the charts related to the current chart showing.
- The Related Reports link brings you to the Zedi TrueChart Reports screen. See Viewing Zedi TrueChart Reports for a description on how to use this function.
- Click this
 icon to move the viewer toolbar to another spot on the screen.
 - Click this
 icon to close the viewer toolbar.
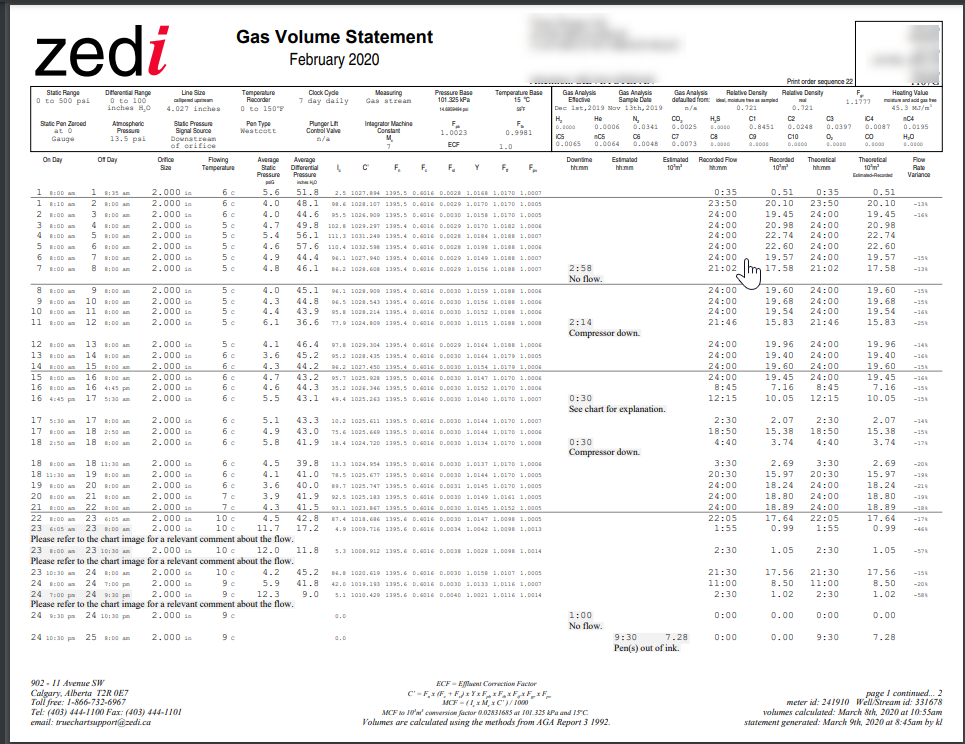
View Gas Volume Statements
Once all charts for a total month have been scanned and processed, the monthly Gas Volume Statement will be available through the well site display link.
1. Click the chart icon within the well site display (Monthly gas volume statement - b)
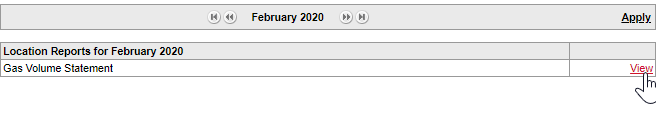
2. Select the Date Range you want to view the Gas Volume Statement for, by selecting the Month.
3. Click Apply
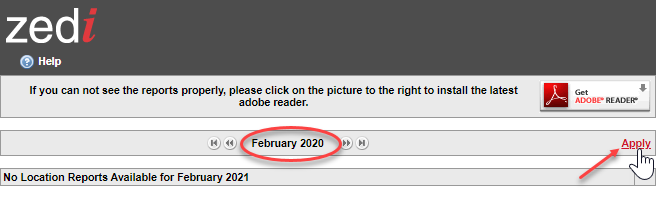
4. Click View for the specific Gas Volume Statement you want to view.
Customer support service by UserEcho
